economy
October 18, 2021
The Taper Effect: Let’s Hope It’s a Non-Event
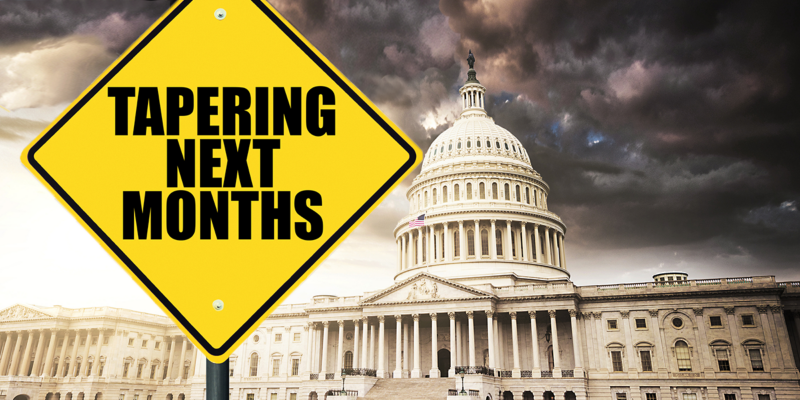
Central bank officials have indicated they’re ready to begin “tapering”—the process of slowly pulling back the stimulus they’ve provided during the pandemic. Back in 2013 when Federal Reserve Chair Ben Bernanke announced the Fed would start tapering asset purchases, it sent a negative shock to the market, causing investors to start selling bonds and pushing the 10-year Treasury yield up from 1.6 percent to more than 3.0 percent. The financial press dubbed the market reaction a “taper tantrum.”
No Time for a Tantrum
What happens this time is anybody’s guess. The Fed has never had to pull back from such a dramatically accommodative position. For most of the past year and a half, it has been buying at least $120 billion of bonds each month. Known as Quantitative Easing, or QE, the tactic has provided unprecedented support to financial markets and the economy. The purchases have helped keep interest rates low, provided support to markets that malfunctioned badly at the start of the pandemic, and coincided with a powerful run for the stock market. This is all great, but have the markets become too dependent on the Fed rushing to the rescue when the economy falters?
Keep Calm and Taper On
The QE program back in 2013 was much smaller, with monthly purchases totaling $85 billion. The Fed’s recent bond purchases have added more than $4 trillion to its balance sheet. Luckily, the programs worked, and the U.S. economy is in much better shape than it was the last time the Fed decided to taper. In fact, just looking at the chart, you might wonder why the Fed is still employing QE at all. Fed leadership felt getting Americans back to work and providing liquidity to financial markets were key to a successful recovery from the pandemic economic crisis, and now it’s time to wean the economy off this massive liquidity build-up. The tapering is expected to start next month and end mid-2022.
Hopefully, with clear communication and a healthy economy, the Fed’s tapering will be a non-event. So far, the markets have taken the news well, but the real test is ahead. Tapering represents a teeing up of future interest rate hikes, though they appear to be at least a year in the distance.
Economic Snapshot: Tapering and the Economy Then vs. Now
| Indicator | September 2021 | May 2013 |
|---|---|---|
| GDP growth (annualized) | 2Q21: 6.7% | 2Q13: 0.6% |
| Core inflation (year-over-year change) | 4.0% | 1.7% |
| New home sales (annualized) | 740,000 | 428,000 |
| Existing home sales (annualized) | 5.88 million | 4.55 million |
| Unemployment rate | 5.4% | 7.5% |
| 10-year U.S. Treasury | 1.5% | 2.1% |
| Asset purchases per month | $120B | $85B |