economy
November 2, 2020
Eyes on the Economy: Employment, NFIB Index, Housing

Employment Slowly Improves
The September job numbers show that while the labor market is making progress, the pace is slowing. Compared with August, fewer states reported lower unemployment and higher employment. New Jersey, New York and Wyoming reported the largest over-the-month percentage gains in employment. Hawaii had the highest unemployment rate in September, followed by Nevada, while Nebraska had the lowest rate, followed by South Dakota and Vermont.
All regions will continue to slow, but the West and South are somewhat more likely to shed jobs—largely due to their outperformance to date, which gives each area more room to decline. The opposite holds for the Northeast, which should experience a steadier path as it emerges from a deeper hole. Downside risks dominate the outlook for the final quarter of 2020. Chief among them is a second wave of COVID-19 infections overtaking the nation, followed by the lack of fiscal relief to help struggling Americans.
NFIB Index Climbs
Small-business sentiment improved in September as the NFIB index jumped 3.8 points to 104. Business owners appear to be finding their way amid the economic havoc. Broadly, those surveyed report an improving outlook on the U.S. economy, which is encouraging to market analysts as the country enters the last quarter of what has been an extraordinarily chaotic year.
The NFIB Uncertainty Index ticked up 2 points to 92. The index posted its highest-ever reading of 100 in November 2016—the last time we had a presidential election. This time around, we have an election amid a massive health crisis and recovery from the most severe recession on record. This year’s candidates are as polar opposite as any in recent memory. The marked differences in their approach to taxation, public spending and trade, compounded by an ongoing and worsening health crisis, will generate further uncertainty as the election draws nearer. Investors expect that uncertainty to push up volatility in the S&P 500 as the year winds down.
Housing Pauses But Remains a Hot Sector
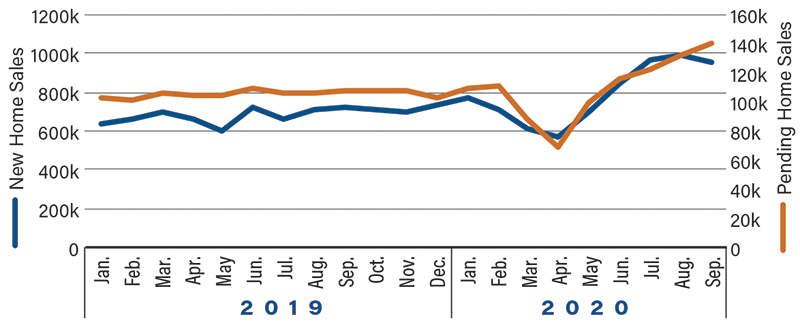
U.S. new-home sales fell in September, but it's premature to conclude that the housing market is losing steam. Other data, such as pending home sales, have remained strong. New-home sales fell 3.5 percent to 959,000 annualized units, weaker than market expectations. New-home sales have surged since the end of the recession. The number of new-home units completed, under construction and not started hasn’t stumbled. The bulk of the inventory is under construction. New-home sales' share of single-family permits was 86 percent in September, which is unusually high for the month, but that share was close to 100 percent in each of the prior few months. With low interest rates helping affordability, housing will continue to be a bright spot for this recovery.
New, Pending Home Sales Remain Strong
Recent Economic Releases
| Indicator | Prior period | Current period (forecast) | Current period (actual) |
|---|---|---|---|
| NFIB Small-Business Sentiment Survey (Sept.) | 100.2 | 100.9 | 104.0 |
| National Unemployment Rate (Sept.) | 8.4% | 8.2% | 7.9% |
| New-Home Sales Units (Sept.) | 1,011K | 1,025K | 1,025K |
Key Interest Rates
| 10/26/20 | 10/19/20 | Change | |
|---|---|---|---|
| Fed Funds | 0.25% | 0.25% | -- |
| 1-mo. Libor | 0.16% | 0.14% | 0.02 |
| 3-mo. Libor | 0.22% | 0.21% | 0.01 |
| 2-yr. UST | 0.18% | 0.16% | 0.02 |
| 5-yr. UST | 0.37% | 0.34% | 0.01 |
| 10-yr. UST | 0.85% | 0.78% | 0.07 |
| 30-yr. UST | 1.64% | 1.55% | 0.09 |
Rate Forecast - Futures Market
| Q4-20 | Q1-21 | Q2-21 | Q3-21 | |
|---|---|---|---|---|
| Fed Funds | 0.25% | 0.25% | 0.25% | 0.25% |
| 1-mo. Libor | 0.10% | 0.10% | 0.10% | 0.10% |
| 3-mo. Libor | 0.20% | 0.20% | 0.20% | 0.20% |
| 2-yr. UST | 0.20% | 0.20% | 0.20% | 0.30% |
| 5-yr. UST | 0.30% | 0.30% | 0.40% | 0.50% |
| 10-yr. UST | 0.70% | 0.70% | 0.80% | 0.90% |
| 30-yr. UST | 1.40% | 1.40% | 1.50% | 1.60% |