economy
August 25, 2025
Eyes on the Economy: Wholesale Prices, Industrial Production, Housing Market

Wholesale Prices Rose More than Expected
The Producer Price Index (PPI)—also known as wholesale price inflation—surged in July, highlighting renewed inflationary pressure in the supply pipeline. Prices rose 0.9% in July, the largest monthly increase in over two years, following no change in June and a modest 0.4% rise in May. On a year-over-year basis, wholesale prices advanced 3.3%, the fastest pace since February. The bulk of July’s increase stemmed from services, which was up 1.1%, driven largely by a 2% jump in trade margins. Machinery and equipment wholesaling contributed heavily, alongside gains in financial services, travel accommodations and freight transportation. Goods prices also rose 0.7%, boosted by a 1.4% increase in food, particularly a 38.9% spike in fresh and dry vegetables. Energy costs edged higher, though gasoline prices declined. Excluding food, energy and trade, core PPI rose 0.6% in July and 2.8% over the past year, underscoring broad-based cost pressures. The report signals firm upstream inflation, with potential implications for consumer prices and Federal Reserve policy.
Industrial Production Slipped in July
Industrial production edged down 0.1% month-over-month in July, reflecting broad but modest weakness. Manufacturing output was flat, with production for durable goods production rising 0.3%, led by gains in electrical equipment and aerospace, while nondurables production fell 0.4% as output declined across all categories. Mining output declined 0.4%, though it remained 1.9% above year-ago levels, while utilities dipped 0.2% on weaker electric generation. Among market groups, consumer goods rose slightly, supported by automotive products and a small gain in chemicals and energy. Business and defense equipment advanced, but construction and business supplies slipped. Capacity utilization moved down to 77.5% overall, with manufacturing at 76.8%, mining at a still high 90.3% and utilities lagging at 70%. The data underscore a sector holding above year-ago levels but operating below historical norms.
Housing Market Stalls as Affordability Remains a Challenge
The U.S. housing market remains under significant pressure, weighed down by affordability challenges and weak buyer traffic. Builder sentiment, as measured by the National Association of Home Builders/Wells Fargo Housing Market Index, has stayed in pessimistic territory for 16 consecutive months, with August registering a reading of 32. Elevated mortgage rates and persistent supply-side constraints—ranging from labor shortages to regulatory costs—continue to dampen single-family home demand. Affordability is the central obstacle, with buyers delaying purchases in hopes of lower rates. To attract buyers, 37% of builders reported cutting prices in August while two-thirds offered sales incentives, the highest share since the pandemic period.
Construction trends reflect mixed signals. Single-family permits fell 5.6% year-over-year in the first half of 2025, underscoring waning demand. However, total housing starts for all home types increased 5.2% month-over-month in July. Single-family homes showed a modest rebound of 2.8% month-over-month but remain 4.2% lower year-to-date, with the pipeline of single-family units under construction at its lowest level since early 2021. In contrast, multifamily construction has shown resilience, posting a 9.9% monthly gain. Overall, the sector is navigating a fragile balance between affordability headwinds and shifting demand.
Homebuilder Confidence Remains Low
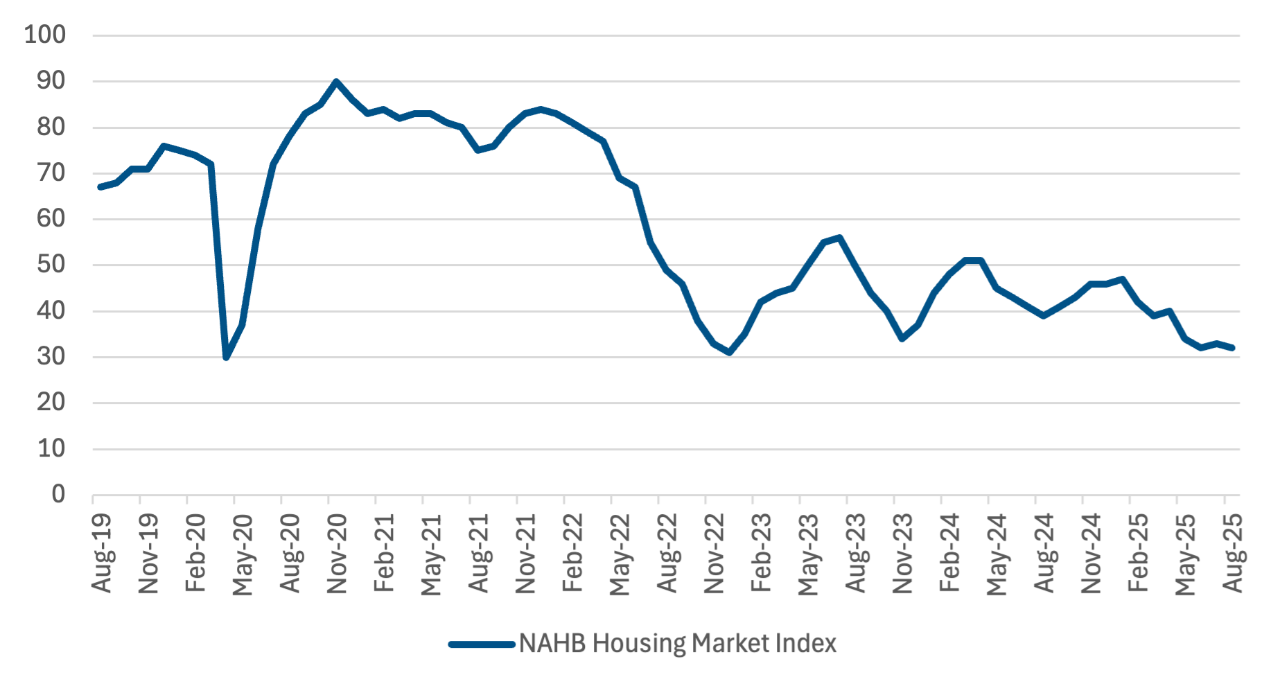
Source: Trading Economics.